FlowmapBlue
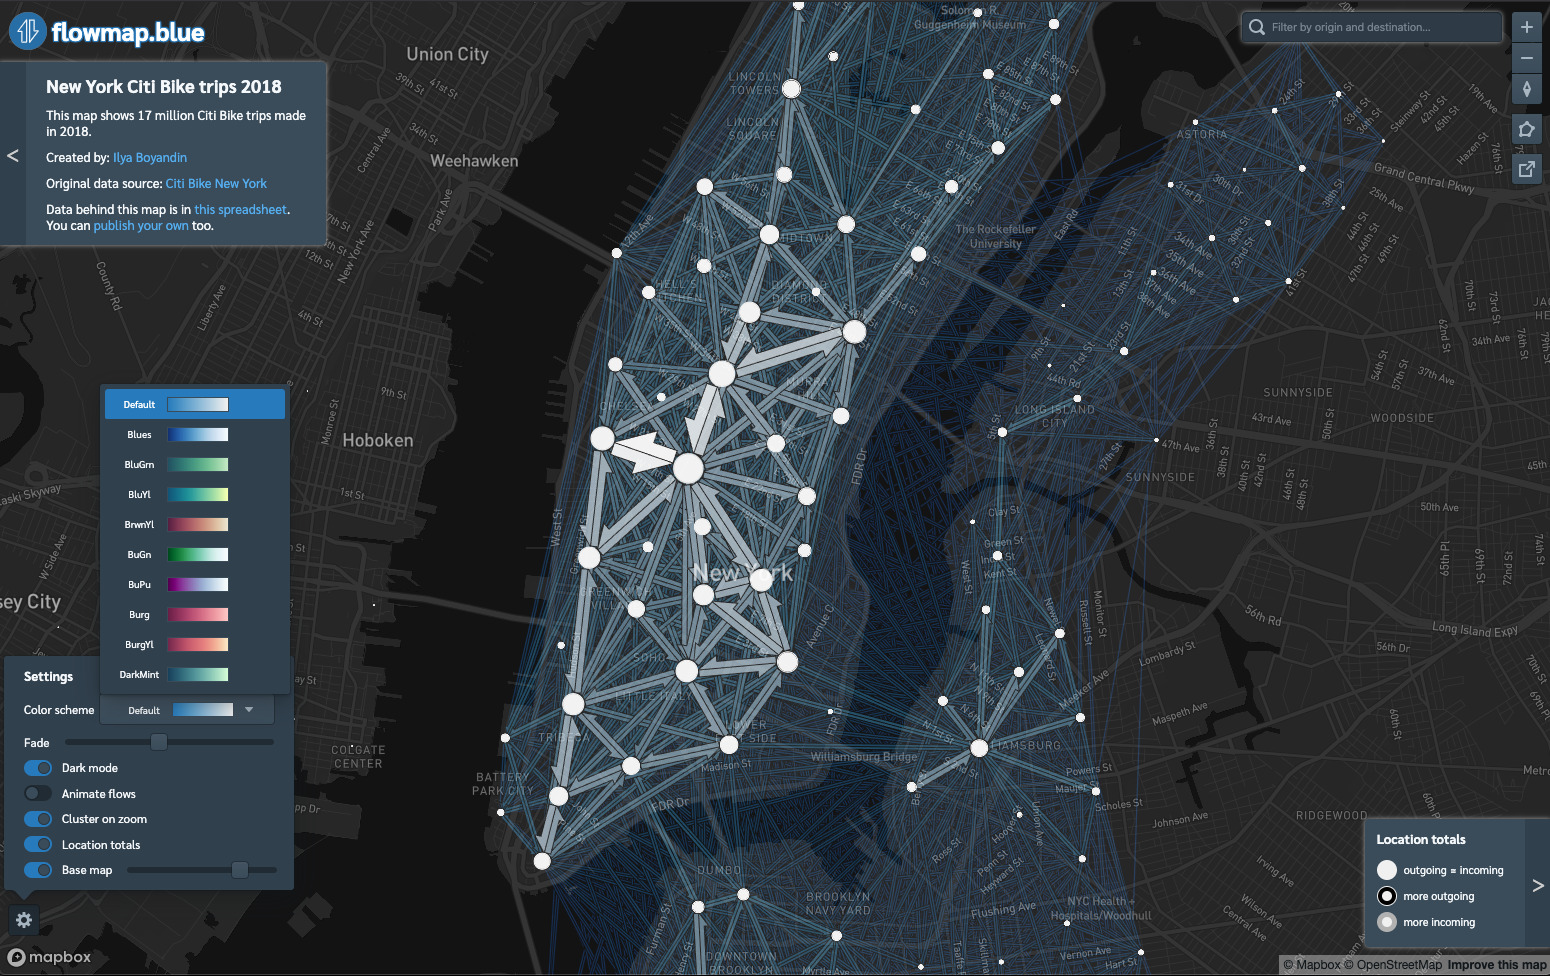
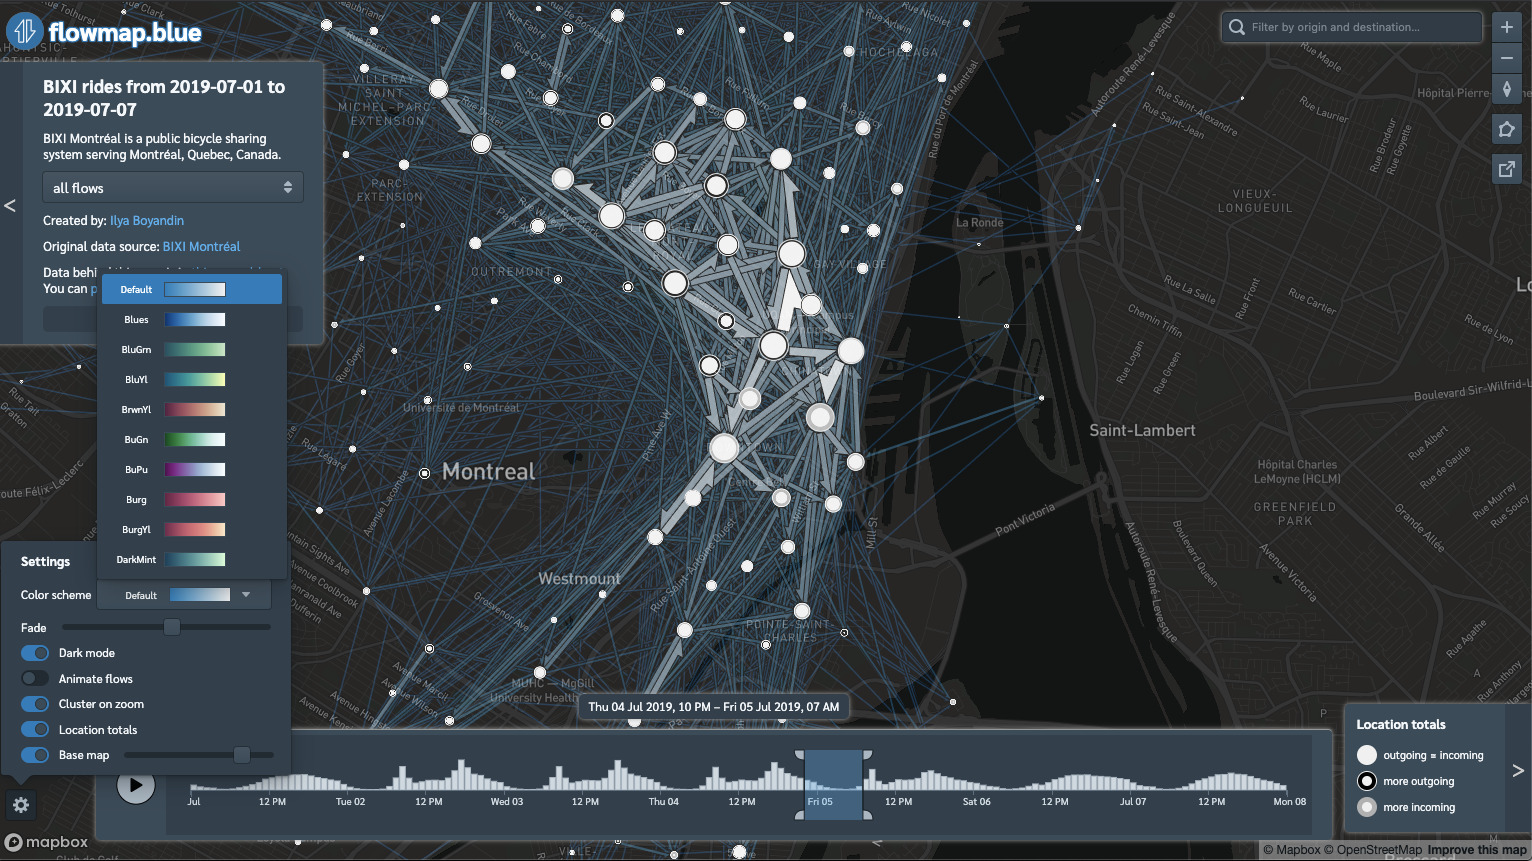
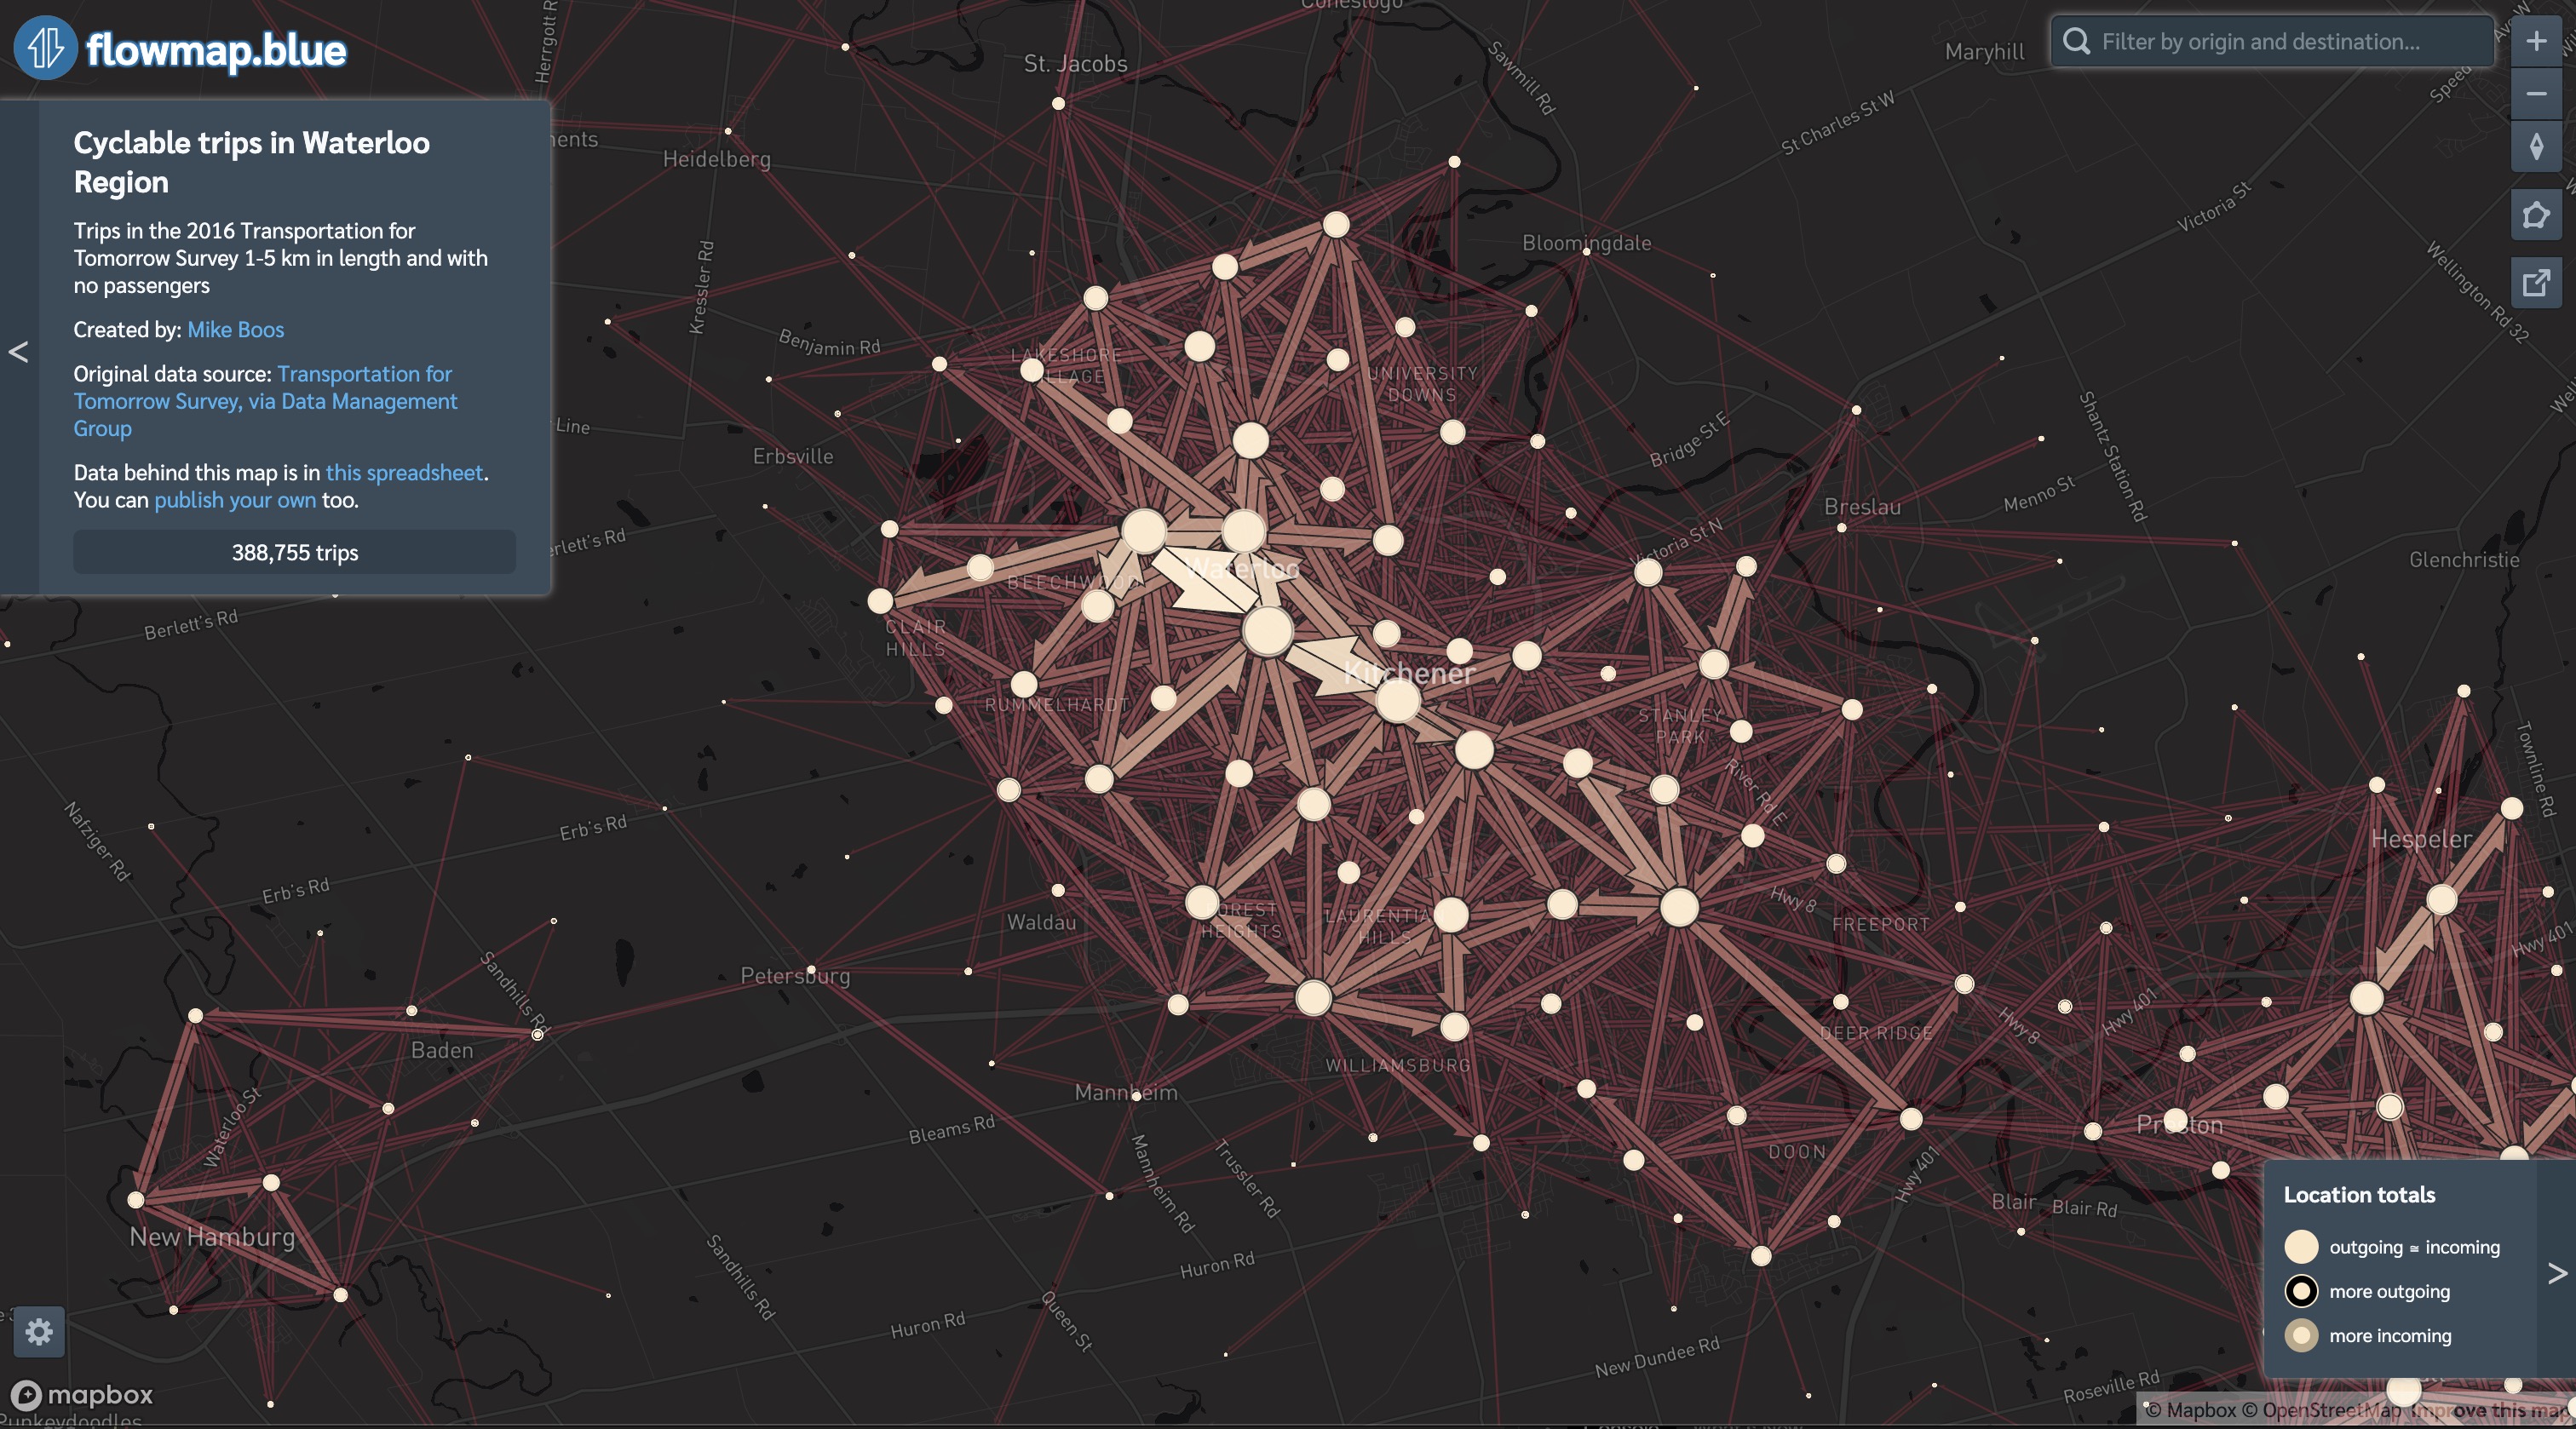
FlowmapBlue is a free tool for representing aggregated numbers of movements between geographic locations as flow maps. It is used to visualize urban mobility, commuting behavior, bus, subway and air travels, bicycle sharing, human and bird migration, refugee flows, marine traffic, freight transportation, trade, supply chains, scientific collaborations, epidemiological and historical data and data on many other topics.
The main goal is accessibility: people who are not programmers or GIS specialists can prepare a simple spreadsheet, connect it to FlowmapBlue, and publish an interactive map. The tool handles the visual encoding, map interaction, filtering, clustering, and sharing mechanics that would otherwise require custom development.
The project won bronze at the Information is Beautiful Awards in 2019.
Until recently making flow maps has involved manual drawing, knowledge of programming or specialised software. I had learned from my experience developing flow mapping libraries that there was a need for an easy-to-use tool with which people without special knowledge could make flow maps. This is why I decided to develop flowmap.blue. The tool makes it possible to publish interactive flow maps from data uploaded to Google Sheets. It's free, it requires no installation and allows anyone to create a flow map in no time.